When nowhere is home…

“We started from the bottom now we here…” -Drake

A recent article on the most remote places in America struck a cord with me. The article, published by the Washington Post, utilizes recent work on global travel times that models the transportation networks between any two places on earth, using a range of transportation options. This work, A global map of travel time to cities to assess inequalities in accessibility in 2015, is a tremendous achievement of spatial data aggregation, topological connectivity, and spatial modeling, and is worthy of a post in and of itself.

That said, it was the work done by the Post , using the Global travel time data to determine remote places in the United States that caught my attention. In looking at the map (Figure 1 below), it takes a second to understand what is being modeled. The details are spelled out quite clearly in the article, but of course, I looked through the map first.

Figure 1: Map of travel times in the United States, originally from Washington Post article published February 20, 2018

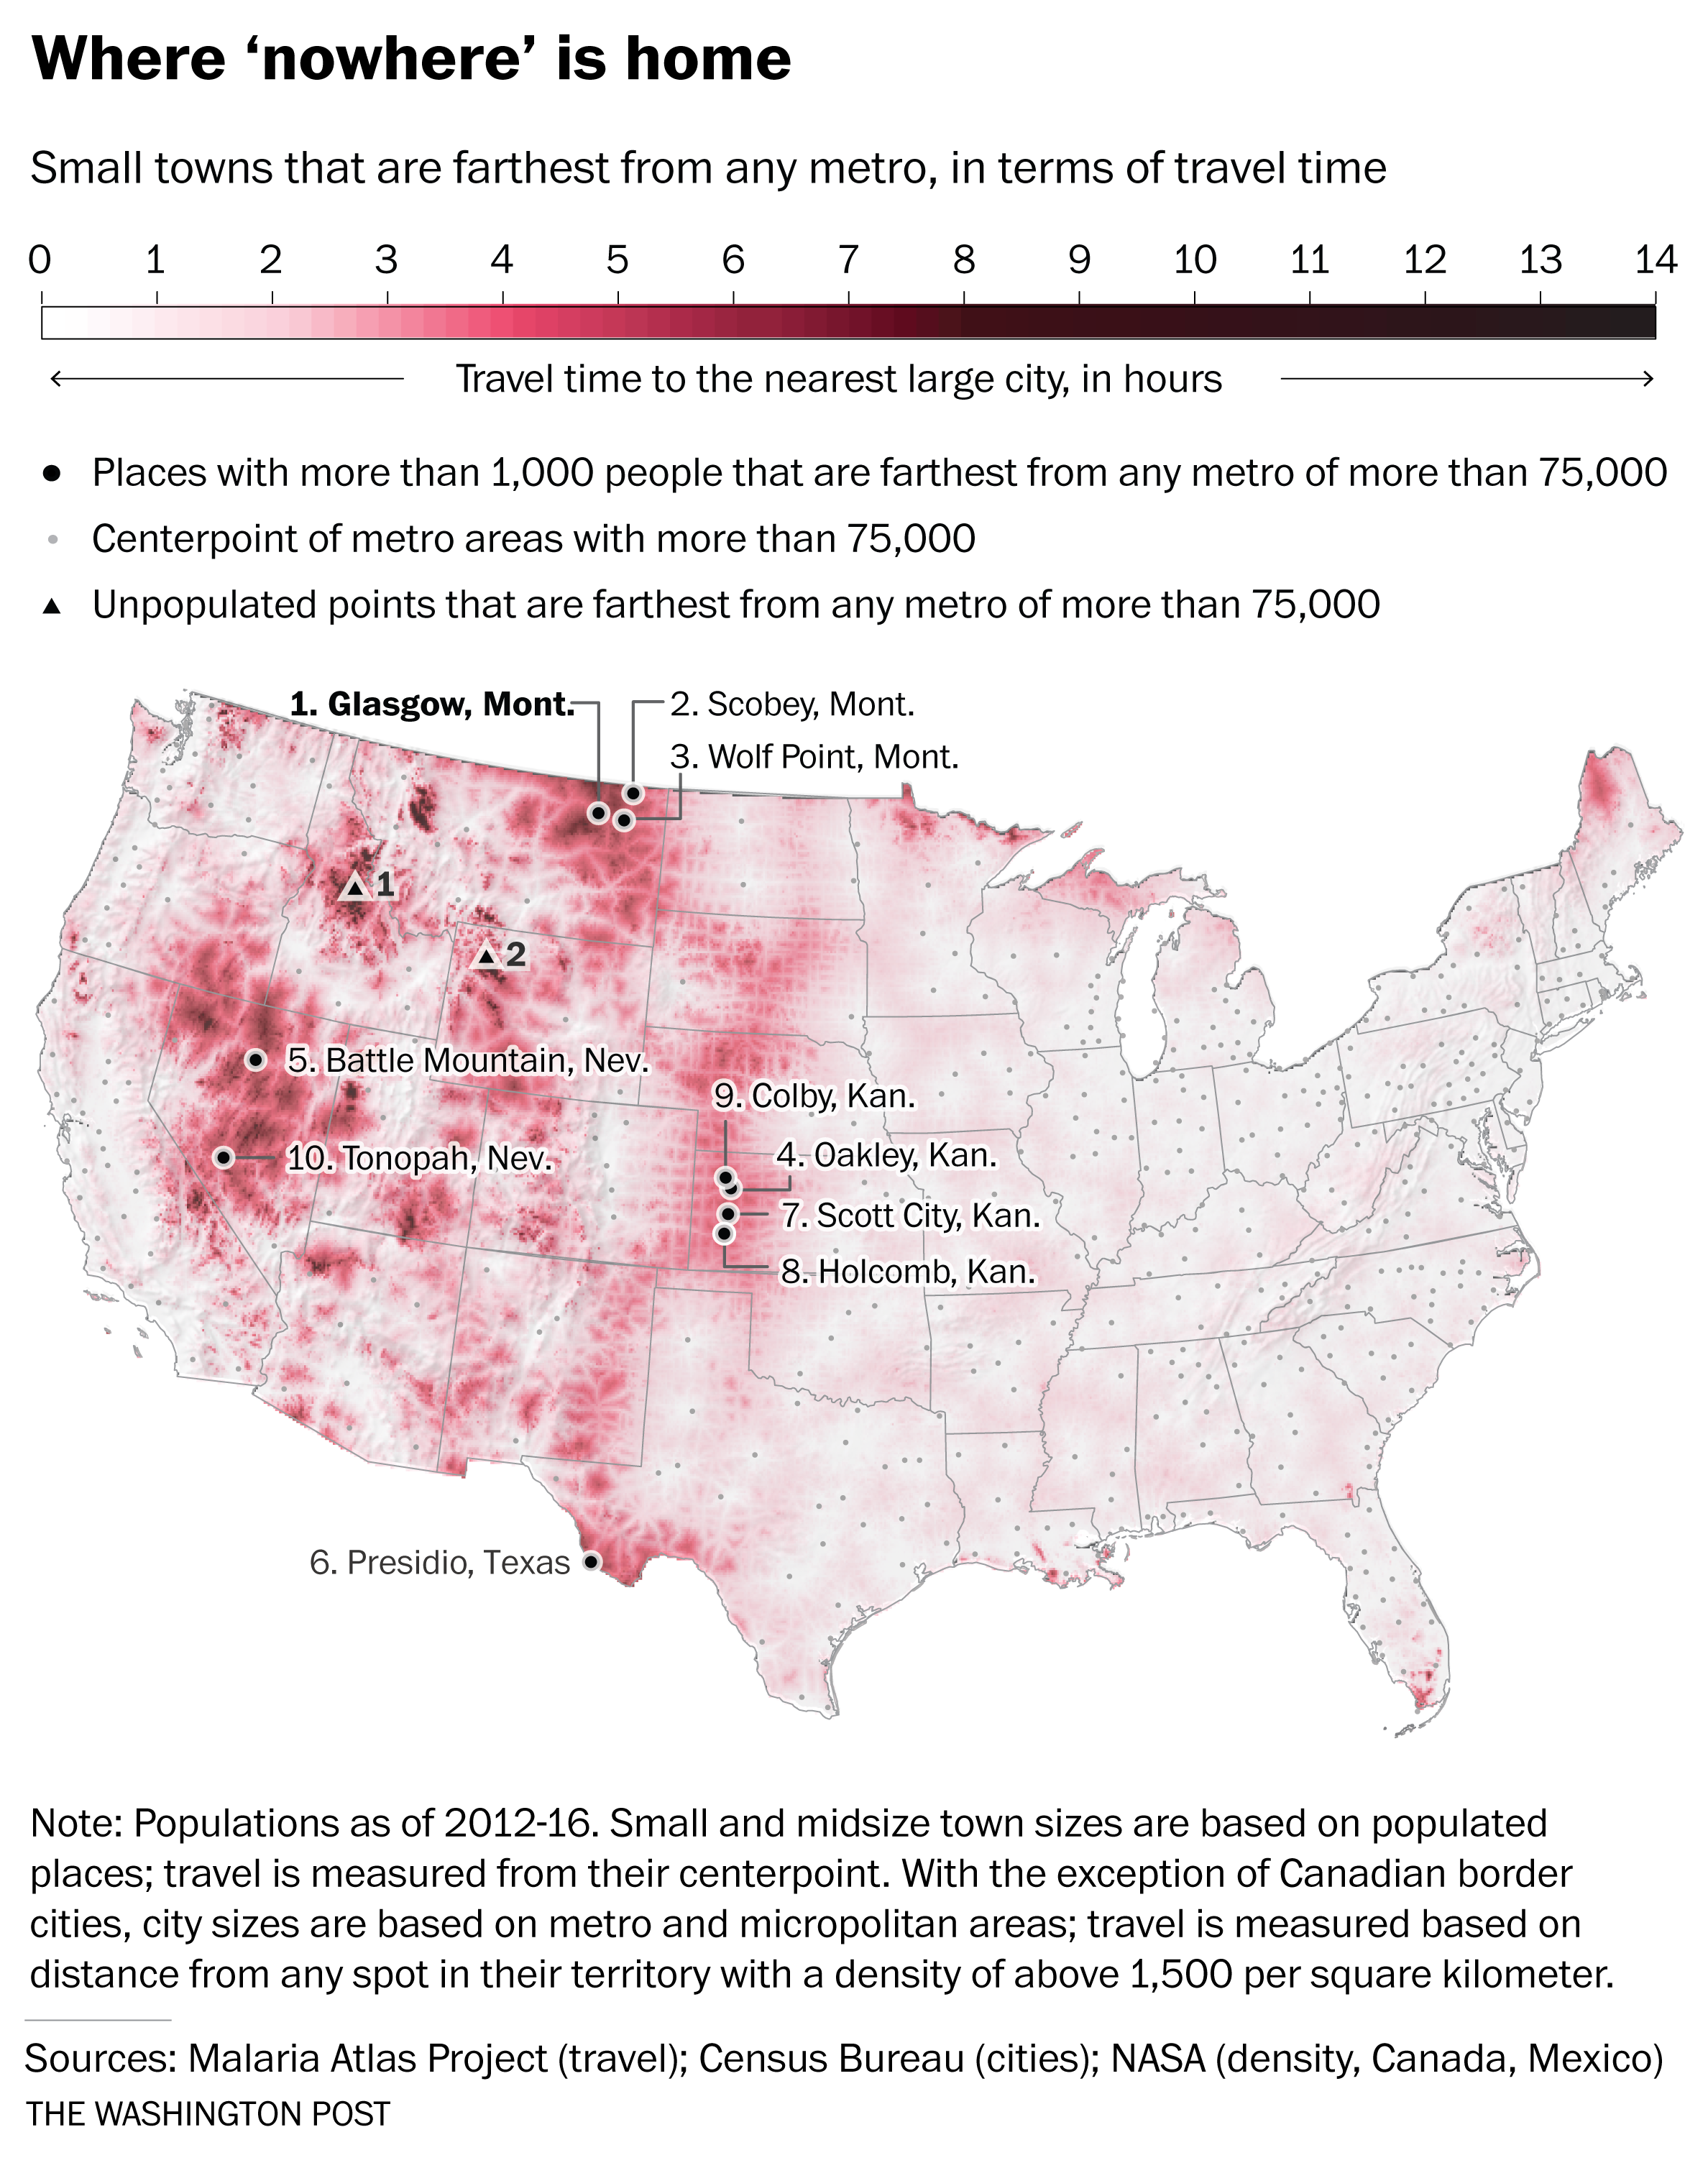
When you think of “remote”-ness, the first thing the comes to mind is a desolate mountain cabin or desert camp. And the map above does highlight the two places with the longest travel times in the Lower 48. However, this is an absolute value of remoteness, a one way path. The more interesting component of this analysis is the comparative definition of remote…where the travel time between two actual locations is calculated. The desolate mountain cabin is the domain of a single person…what does it mean to be remote when you live in an actual town?

In this analysis, the travel time between every location in the Lower 48 U.S. and the nearest metropolitan area (city with a population greater than 75,000) is derived from the Global travel data. This creates a continuous surface where every 1,000m x 1,000m grid cell contains a travel time. When mapped, this data forms a type of “travel-shed” map that is reminiscent of hydrologic and watershed maps.  Commensurately, the boundaries of the travelsheds are the areas with the largest travel times, and help delineate regional zones where a particular city is dominant.  The travel speed of various transport modes are also reflected in the data, e.g.,  interstates are faster than secondary highways, and that fact imprints a pattern where the fastest paths resemble river valleys in the travelsheds.  Finally, the  ridges between travelsheds provides the “remote” areas, farthest away from population centers.

From a macro perspective, the highly populated eastern U.S. shows much lower variation in travel times when compared with the more sparsely populated areas of the Great Plains, Rocky Mountains, and intermontane areas of the western states. This is a combination of higher overall population and a fairly even distribution of populated places…essentially there are so many people that it’s hard to get too far from a larger town. Notable areas of high travel times include the intermontane areas of Utah and Nevada, the Trans-Pecos region of West Texas, and an interesting ridge through the mid continent that roughly follows the western extent of the High Plains physiographic region.

In the next step of the analysis, the travel time layer is intersected with the location of all American cities greater than 1,000 people, and the travel time between the small city and the nearest city of 75,000 people was calculated. Brilliant. In fact, they did the same analysis comparing towns with population larger than 1,000, 5,000, and 25,000. The ranked list of cities is displayed in Figure 2 below.

Figure 2: Ordered list of most remote towns in the Lower 48 U.S., with the Kansas High Plains towns highlighted (added for this blog post). Originally published in the Washington Post article published February 20, 2018

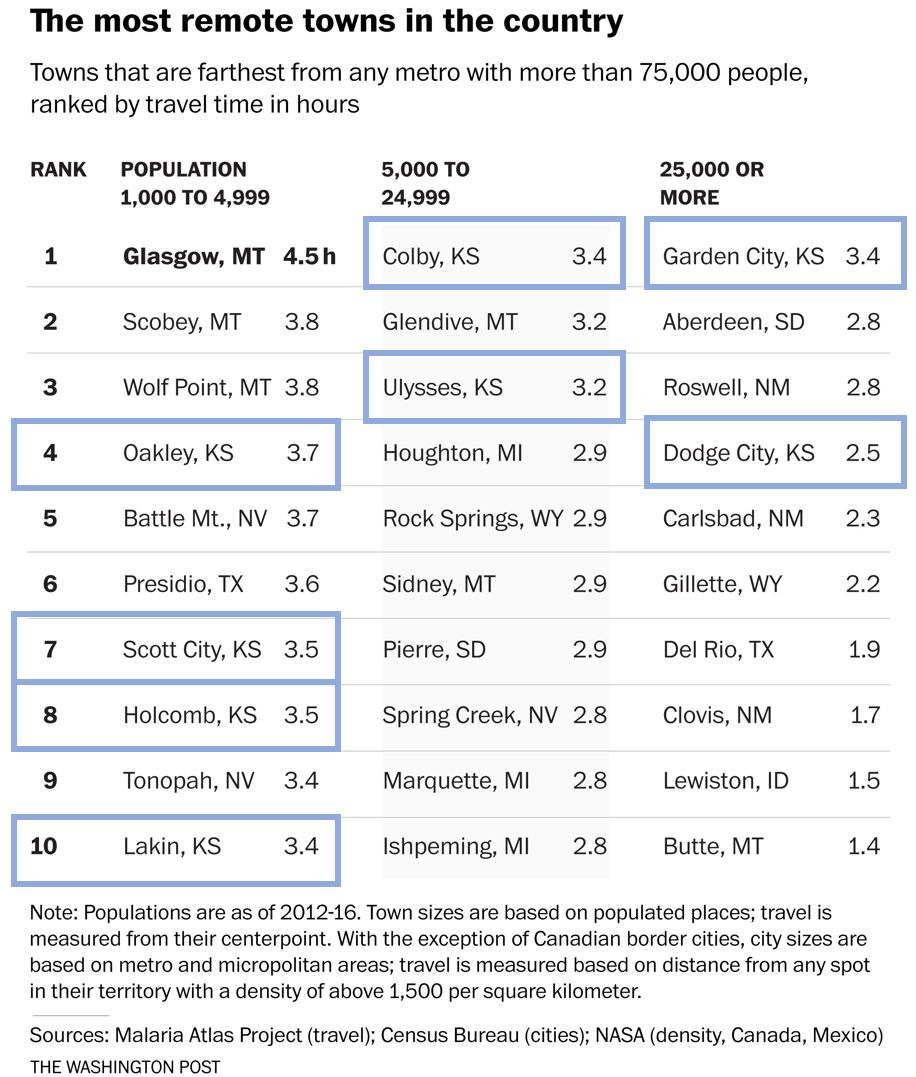
So why is this significant to me? Beyond being a super slick GIS application, two other reasons. First, I grew up in southwest Kansas, an area that I have often described to people as being about as far away from anything as you can get in this country…and it turns out, I was right. My hometown is #10 on the list…and four other locations in the top 10 of the small towns list are its neighbors. Additionally, other towns in southwest Kansas top the most remote in the mid- and large- town lists. The longitudinal ridge of “remoteness” that extends along the 107 degree west longitude line seems to be a “travel-shed” boundary between the populated places of the Colorado Front Range and those in eastern Kansas.

The second interesting element of this analysis is how it compares to my previous work on “flatness”. I haven’t done any quantitative work on this, but a visual comparison of the two maps seems to show a bimodal distribution of remote places…they are either very flat or very not flat. Conjecture could lead one to intuit that flat places are remote because they may be uninteresting to live, while not flat place are remote because it is difficult to get to them.

But I think that is simplistic, the flat remote places are instead driven by the economic geography of the region. For southwest Kansas, that means an economy  dominated by agriculture…a lifeway that increasingly requires less and less people, but that still demands population centers at regular intervals to efficiently collect and transport the harvests. This leads to the mix of low population, that is regularly dispersed, and occupies flat terrain. Compare this to the remote area of central Nebraska, which is also on the 107 degree meridian, but that doesn’t appear in this list because there are no settlements that exceed 1,000 people. The Sand Hills mean there is no agriculture, no economic lifeway that requires any substantial grouping of people.

In conclusion, this list of towns reads like a schedule of summer swim meets from my youth…and it’s just bizarre to see it spelled out in a national newspaper. These places that I know well, that I spent significant parts of my life studying the archaeological and climatic past of…are in fact, some of the most remote, yet connected, places in the United States.  And now having spent almost 10 years in DC, I’ve come to appreciate just how far the cultural distance is between these remote outposts and the populated centers of the coastal U.S.

The human geographies that occupy these urban / rural divides is tremendous, and there is no clear path between them.  Communication technology has shrunk these distances, whether it be the satellite dishes that were prevalent in my youth, or the internet now, technology has homogenized the cultural experience to a large degree…overcoming the limitations of spatial distance. But these areas do feel “remote”, they are a long way, both in culture and travel distance, from the economic and cultural engines of our society.

It is interesting that the original goal of the global travel time data was to assess the inequalities that become manifest when the accessibility to cities is limited. The value of this data for the Sustainable Development Goals (SDG) is clear, and I think will be used in a myriad of ways to plan and contextualize international development efforts. But what does it mean for our society, what does being remote inside the United States mean? What inequalities will become manifest for our own citizens as accessibility to cities remains limited? Maybe this map should be used for some domestic sustainable development?

And while it was the personal connection to my life that drew me to this work, it is clear the data and methodology presented here do offer an valuable framework for understanding the implications of population distribution. In the SDG context, the use of these spatial tools will positively impact development planning and execution, and the team who compiled this data should be applauded. The geospatial revolution continues…

Van Dam, A. (2018, February 20). Using the best data possible, we set out to find the middle of nowhere. The Washington Post, Wonkblog. https://www.washingtonpost.com/news/wonk/wp/2018/02/20/using-the-best-data-possible-we-set-out-to-find-the-middle-of-nowhere Cite
Weiss, D. J., Nelson, A., Gibson, H. S., Temperley, W., Peedell, S., Lieber, A., Hancher, M., Poyart, E., Belchior, S., Fullman, N., Mappin, B., Dalrymple, U., Rozier, J., Lucas, T. C. D., Howes, R. E., Tusting, L. S., Kang, S. Y., Cameron, E., Bisanzio, D., … Gething, P. W. (2018). A global map of travel time to cities to assess inequalities in accessibility in 2015. Nature, 553(7688), 333–336. https://doi.org/10.1038/nature25181 Cite

Geography 2050 – Future of Mobility

Every November the American Geographical Society holds its flagship Fall event, the Geography 2050 symposium. Designed to be a multi-year strategic dialog on the trends that will affect the planet in 2050, the theme for 2017 was the Geography 2050: The Future of Mobility.

In the Geography 2050 sequence, we envisioned the world of 2050, then focused on the inter-related topics of urban growth, sustainability, mobility, and next year will be energy.  For each event we assemble a highly curated set of sessions and speakers that combine a geographic perspective with the academic, government, and business communities in a way that no other event replicates.

Background

In order to understand the roots of Geography 2050, and what we are trying to accomplish as the American Geographical Society (AGS), some backstory is needed. Starting four years ago, the AGS began a dramatic revitalization effort, one that would bring a significant influx of new energy, people, and ideas into the Society. Spearheaded by the now AGS Chairman, Dr. Chris Tucker, the idea of AGS 2.0 has taken root…with Geography 2050 one of its central concepts. This video, from the initial Geography 2050, describes the 2050 concept in more detail:

This synthesis is the hallmark of the AGS, and a differentiating factor in the discussions we facilitate.  AGS history represents some of the best applications of the geographic perspective over the last 165 years, whether that be exploration, commerce, diplomacy, defense, or education. As we envision the role of AGS in the 21st century, we see a United States in need of greater geographic awareness. We see one role of AGS as a means to help foster a national dialogue on spatial literacy, and be a force for change in geographic education. These values are summed up well by AGS President Emeritus (and my Ph.D. advisor), Dr. Jerome Dobson, in this short video from the original Geography2050:

Highlights

The Future of Mobility event continued this trend, and the quality of sessions may have even exceeded previous years (kudos to the Dean Wise, AGS Councilor and the conference chair). It was hard not to leave the conference amazed at the pace of change in the mobility sector, and how close this next wave of technologies is to fundamentally changing how we are spatially organized. Videos for the sessions are being finalized now, and I’ll update when they are complete (see the Program here). Below are a few of my takeaways from the conference (and since I’m not an expert in mobility and transportation, I learned a tremendous amount from the sessions).

Clearly electric vehicles are already here, but when combined with longer battery life, increasing levels of automation, and “transport as a service” business models, the economics of automobile ownership and utilization change dramatically. The impact of this change on individual behavior and public planning for infrastructure leads to some widely divergent models that swing between transport utopia and massively underfunded public transportation.  And this does not account for the potential of automated trucking and freight transport. We are already on the cusp of these changes, and even some of the best minds in transportation planning don’t really know what is going to happen in the next 10 years…let alone the 33 years till 2050.

Vertical take-off and landing (VTOL), flying cars, and other personal “jet pack” devices are becoming a reality. At this point, each of these are still piloted by humans, but clearly have the potential to become more and more autonomous (or remotely piloted). The already stressed regulatory environment for simply figuring out how to handle “beyond line of sight” human-flown drones, is going to be incredibly burdened as autonomous package delivery, flying taxi service, and personal VTOL devices become more common. The domestic and international airspace management regulations are incredibly complex, and accommodating these new forms of transport will be a generational challenge.

Hyperloop…wow…paradigm shift in the making. The potential of this technology is so absolutely incredible, it is truly difficult to appreciate the implications on human society. If we have any political will to accomplish great things left in this country, we should move as fast as possible towards Hyperloop. America’s bet on the automobile has been an incredible benefit to our society, and yet it has also locked us into a transport paradigm that is strangling our cities. From everything I saw, Hyperloop is the only technology that could fundamentally change the equation. The sheer speed that it travels will make disparate cities the same travel time away as current metro stops. To view some of the proposed Hyperloop routes and travel times between stops, check out the winners of the Global Route Challenge…with interactive maps.

Honoring Digital Cartography

On a personal level, this year was the first time that I’ve participated in Geography 2050 as an AGS Councilor (I spoke at the first event in 2014 before I joined the AGS Council). Having known and studied under Dr. Dobson since his arrival at the University of Kansas in 2001, I have been long steeped in AGS and its proud traditions. When Chris first proposed AGS 2.0, and started to invite new Councilors, I knew I wanted to be part of bringing new energy into the Society.

What I bring to AGS is an expertise in geographic information science and technology. Building on that background, my goal as a Councilor is to ensure AGS continues to be at the fore of geographic technology, and that the Society begin to formally recognize the contributions of those who are responsible for powering the “geospatial revolution”. Over the last 20 years geographic technologies have revolutionized our society (Global Positioning Systems, high resolution satellite imagery, in-car navigation, interactive web maps, etc…), and it is important that the Society formally acknowledge those in government, industry, and academia who contributed.

To that end, the 2017 edition of Geography 2050 marked the first attempt to do this. I believe there are many people who deserve to be honored for their contributions to the post-millennium explosion in digital geography, so nominating the right people had to be a mix of contributions and applicability to this year’s 2050 theme of mobility. Given that combination, it was clear that Brian McClendon and John Hanke were the right choices to nominate for the AGS O.M. Miller Cartographic Medal. I made the nomination, and the AGS Vice President and Chair of the Awards committee, Deborah Popper, wrote up two wonderful award letters that were read at the ceremony.

A Conversation with John Hanke and Brian McClendon

Geography 2050 panel: Dr Campbell (left), Mr McClendon (center), Mr Hanke (right). From https://twitter.com/tomfitzwater/status/931604897371475968

In addition to the award, both Brian and John were kind enough to participate in a Geography 2050 session, which was formatted as a conversation with them. It was an honor to moderate this session, a job that required I ask a couple opening questions and then get out of their way. I don’t get anxious speaking in front of crowds often, but have to admit, this one was a bit nerve-racking. But ultimately I think the session went well, and there was a lot of great feedback.

Update: Video of the session has been posted here and embedded below:

The goal of my questions was to first look back on their Keyhole / Google Earth experience, using it as a historical lens to view current trends. Then to discuss trends in autonomy and augmented reality that are affecting mobility. Co.Design (a Fast Company subsidiary) wrote an article on the session that has more detail.

I’d like to thank both of them personally for taking the time out of their schedules to come to New York to accept the AGS Miller Medal and participate in the panel. I certainly learned a lot, and feel that as AGS, we are off to a good start in honoring the pioneers of the modern digital geography movement.

If interested in additional information, Trajectory Magazine recently published an article on the history of Google Earth that provides great background on the evolution of the technology, and its role in the national security context.

Interview in KU Grad Paths

Earlier this summer, I was asked by a colleague at the Graduate School of my alma mater, the University of Kansas, to contribute content for their Grad Paths newsletter. The goal was to describe my work, post-degree, and provide advice to current grad students. It was an interesting exercise to concisely describe my work to a non-geography audience, and in a context of what I think is important for current graduate students who want to pursue work outside the academy after graduation. Below are the questions and my responses.

What do you do? (Usually we ask that this relates in some way back to how they use their graduate school knowledge and/or training in their current position if possible.)

I am an applied geographer that specializes in geographic information science and technology. Through Sand Hill Geographic, I provide consulting and technical services to organizations that are trying to better utilize the geographic dimensions of their information. Being in Washington DC, I try to work at the intersection of the national security, diplomatic, and development communities.

In the last eight years I’ve been a Geographer at the U.S. Department of State, an executive at a geospatial software startup, and now run my own consulting business. I’ve worked on projects related to several U.S. Government agencies including the Department of State, Department of Defense, U.S. Agency for International Development (USAID), as well as the World Bank.

Each of these organizations need to answer questions that are critical to their operations, and geography (technical, physical, and human) can play a large role. Below are few examples from each institution:

• For the State Department, understanding how conflict or natural disasters will impact vulnerable countries is a key concern. What are the dynamics of refugee movements (who are they, where are they coming from, where are they going), and what social, economic, and policy impact will it have regionally and globally? Numerous examples of this work can be found at the Humanitarian Information Unit (HIU) website, https://hiu.state.gov

• For USAID, what is the spatial extent of a drought and how do we preposition relief supplies to deliver aid? Where are all the buildings in an area with an on-going malaria eradication program, and how can we plan to spray all the buildings?

• From a national security perspective, how can we discover, monitor, and predict threats? This can range from mapping the movements of foreign militaries to the spread of Ebola. The ability to anticipate threats gives policy makers a decision advantage. Geographic technology, spatial analysis, and increasingly human geography, are valuable tools for our national security analysts.

• For the World Bank, the goal is to make financial investments that will reduce poverty and increase equality. In order to prioritize investments, fundamental questions about a country’s exposure to natural disasters, and their related disaster risk management plans, are required. Mapping risk and measuring the impacts of financial investments on that risk are key metrics for evaluating a program’s effectiveness.

In all these cases, I help build workflows that focus on the geographic elements that provide insight to these questions, and construct technical systems to collect, analyze, visualize, and share data and analysis products. Often the technical solutions are very similar, but their implementation into various bureaucratic institutions is very different.

The need for quality geographic data to use in these systems is a common requirement, and is often lacking. To address this problem, I helped create MapGive, a crowdsource mapping initiative at the State Department designed to catalyze open geographic data production to support the humanitarian, development, and disaster risk reduction communities. This project has supported open mapping efforts all over the world, and has played a significant role in many large natural disasters and humanitarian emergencies.

My graduate school experience provided the academic training and applied research in Geography, Geographic Information Systems (GIS), and Remote Sensing, that form the core of what I do today. I came to DC well equipped to do the work.

What is your favorite aspect of your job/career?

My favorite part of this work is simply the huge array of issues that can benefit from the application of geographic knowledge and technology. The explosion in geographic technology means we have an ever-expanding array of tools to collect, analyze, visualize, and share data and analysis. These are essentially new vectors for doing what geographers have always done…derive new insights by utilizing a spatial perspective. The work is never boring.

What advice do you have for current graduate students?

Enjoy the process.

Graduate school is grueling, and often takes a toll on students. Focus on the goal of completing the thesis or dissertation, and work to integrate writing into your life systematically. Realize that getting the PhD is actually the start of your career.

Make your work relevant.

If you want to be a practitioner in your field, spend time outside the academy. Take the internship with an agency or company. It is critical to get real world experience. Often you’ll find you have more than enough academic knowledge to do the job, but you lack the social network, understanding of bureaucracies, or funding mechanisms that are required to turn that knowledge into policies or projects. This experience will not only make you more effective, it can provide a unique kind of confidence when you return to school, that you can and should finish the degree.

Dream Team and the Rise of Geographers

Dream Team
 Image links to original article.

Back in September, the team at Government Executive did a fantasy football – inspired take on government leadership. Entitled the Dream Team, the short piece highlights eight bureaucrats found throughout the government (or formerly in the government in my case).  To use the words of the GovExec authors, “here are some of the folks we’d love to see on any leadership team tackling the kinds of big problems only government can address.

Collectively, this group has a range of skills: finance, acquisitions, program and project management, legal, IT security, HR, software platform development, disaster recovery…and somewhat curiously, two geographers.

I’m humbled to have been included on this list, particularly given the accomplishments of the other geographer, Mike Byrne.  That said, what I find more intriguing is how two geographers made this list to begin with. What is it about geography that is gaining the attention of management and leadership journalists? Why would they think these are the skills needed on government teams to solve big problems? And why now?

Starting with the question of awareness, its clear that digital geography and maps have captured the public’s attention. The combination of freely available Global Positioning System (GPS), ubiquitous data networks, high resolution imagery, increasingly powerful mobile devices, and interoperable web services has fundamentally changed how the average person interacts with maps and geographic data. In the ten years since the introduction of Google Earth, the expectation of the average person is now to have complex, updated, descriptive, interactive maps at their disposal anytime, anywhere, and on any device. This shift is nothing short of revolutionary.

And while the glitz of slippy maps and spinning globes has brought the public back to maps, there is more to the story of why geographers are critical elements of multidisciplinary leadership teams.  I believe there are two key characteristics that set geographers apart: Information Integration and Problem Solving. The first is the the capacity of the spatial dimension to integrate information across disciplines, and the second is how spatial logic combined with digital tools can predict, analyze, and visualize the impact of a policy decision.

Begin TL;DR

Let’s begin with the idea of information integration. At its core, Geography is a spatial science that utilizes a range of qualitative, descriptive, quantitative, technical, and analytical approaches in applications that cross the physical sciences, social sciences, and humanities.  It may seem trite to say, but everything happens somewhere, so anything that involves location can be studied from a geographic perspective.  Where most disciplines have fairly defined domains of knowledge, Geography, and its focus on the spatial dimension, cuts laterally across these domains.

The cross cutting nature of location is the fundamental reason why Geography is in a resurgence.  Geographic location provides the mechanism to integrate disparate streams of information. Data that relates to one discipline can be linked to other data simply by its location. As a conceptual framework, Geography is an integrative lens, i.e., what are the forces that interact to define the characteristics of this location, and when combined with Geographic Information Systems (GIS) technology, spatial location acts as the relational key used to link tables of information together in a database.  It is this union of mental framework and technology that provides Geography a unique capacity for information integration.

However, information is typically aggregated for a purpose, the goal is to solve a problem, find an answer, understand a situation, and Geography offers unique tools for that as well.  All problem solving is about breaking a complex problem into divisible, solvable units. For a geographer this starts with the application of spatial logic to the problem; this means when solving a multivariate problem, a geographer will accept the spatial distribution and spatial associations of a phenomenon as primary evidence, and then seek to discover the processes that led to that distribution. This contrasts most disciplines, where process based knowledge on individual characteristics are combined, then tested against the spatial distribution .  The elevation of spatial logic over process logic is the key differentiator between a geographer and a domain-specific analyst.

Bringing spatial logic into the technological domain relies upon Geographic Information Science (GISc) to provide the conceptual framework, algorithms, and specialized tools needed to analyze data encoded with location information.  It is the analytical power of these functions, integrated with the data collection, storage, retrieval and dissemination tools of GIS, that form the toolkit for problem solving used by geographers.  Additionally, cartographic visualization provides a mechanism to encode these data and analysis so that complex spatio-temporal relationships can be displayed and quickly understood.  Whether it is data exploration, sense making, or communicating results, displaying geographic data in map form is a tremendous advantage over text.  And now with the web, cartography can be interactive, cross-multiple scales, and be dynamic through time.

So, why is now the time for geographers?  The answer is threefold, first it has to do with the scale and complexity of problems we are facing, second is the amount and variety of information that can be applied to the problems, and third is the maturity of the digital geographic tools. Finding solutions to deal with climate change, energy, sustainable development, disaster risk reduction, and national security will require interdisciplinary approaches that are firmly grounded in the spatial dimension.  With the transition to a digital world, society (governments included) finds itself in a state of information overload. In this world where data is plentiful, value shifts from acquiring data to understanding it. Geography as a discipline, and geographers equipped with a new generation of spatial information technology, are well adapted to this new paradigm.

If done correctly, the modern geographer has broad academic training across a range of disciplines, uses the spatial perspective as a means of information integration and analysis, and is facile with the digital tools needed to collect, store, analyze, visualize, and disseminate geographic information and analysis.  Combine these skills with management and leadership training, and the geographer becomes a portent fusion.  One that I think this article correctly identifies as critical to the leadership teams needed to solve big problems.

Here they come to save the day...
Here they come to save the day…
Dobson, J. E. (1992). Spatial Logic in Paleogeography and the Explanation of Continental Drift. Annals of the Association of American Geographers, 82, 187–206.