USGIF Achievement Award

One of the interesting things about the “Imagery to the Crowd” projects has been the positive feedback we have received from a range of different communities. Ultimately we built the process from a belief that free and open geographic data could support the effective provision of humanitarian assistance, and that the power of open source software and organizations were the key to doing this efficiently.

Our goal with Imagery to the Crowd is to provide a catalyst, in the form of commercial high-resolution satellite imagery, to enable the volunteer mapping community to produce data in areas experiencing (or in risk of) a complex emergency. In many ways I thought of this process as trying to link the “cognitive surplus” of the crowd with the purchasing power of the United States Government, to help humanitarian and development organizations harness the power of geography to do what they already do better.

Somewhat surprisingly, a community outside of the humanitarian sector recognized the potential impact of this process, and the HIU was awarded the United States Geospatial Intelligence Foundation (USGIF) Government Achievement Award 2012 (Press Release, Symposium Daily pdf, Video page). The award was presented at the GeoInt Symposium in Orlando, FL (Oct 7-14 2012). Below is a video of the awards presentation, and includes the Academic and Industry Division winners from this year. The section on the HIU begins around the 7:25 mark.

—————————

—————————–

At the conference I also was on a panel in a “GeoInt Forward” session focused on open source software. This panel was actually the best part of the conference. Typically the first day of the GeoInt Symposium is reserved for the golf event, but this year the organizers included an additional day of panel sessions. In general these sessions were very well attended, and with a full-house of approximately 250 people the session on Open Source Software exceeded my expectations. The session description and other panelists are listed below, and it is clear the defense and intelligence perspective that is GeoInt, but it was an interesting group doing work across a range of different applications. I tried to provide a bit of balance and discussed the philosphical approach to open source, and its potential as an organizing principle for organizations. The Imagery to the Crowd project is built on an a cloud-hosted open source geographic computing infrastructure, so I could speak to the reality of this system. It seems that the coming budget austerity has generated significant interest in open source, and now could be golden opportunity.

From the conference proceedings:
“Open Source Software (OSS) has moved from being a backroom, developers-only domain to a frontline component inside key military capabilities. OSS isn’t doing everything—yet—but it is slowly commoditizing key strategic parts of geospatial infrastructure, from operating systems to databases to applications. In this session, key government program managers will discuss where and how they see OSS moving to solve warfighter needs, as well as assess the gaps in OSS investment and capabilities.”

Moderator – John Scott, Senior Systems Engineer & Open Tech Lead, RadiantBlue
Panelists
• John Snevely, DCGS Enterprise Steering Group Chair
• Col Stephen Hoogasian, U.S. Air Force, Program Manager, NRO
• Keith Barber, Senior Advisor, Agile Acquisition Strategic Initiative, NGA
• John Marshall, Chief Technology Officer, J2, Joint Staff
• Dan Risacher, Developer Advocate, Office of the Chief Information Officer, DoD
• Josh Campbell, GIS Architect, Office of the Geographer & Global Issues, State Department

Reference Cited:

Shirky, C. 2011. Cognitive surplus : how technology makes consumers into collaborators. New York: Penguin Books.

Imagery to the Crowd, ICCM 2012

Here is my ignite talk on the “Imagery to the Crowd” project from the International Conference on Crisis Mapping (ICCM 2012). I’ve attended each of the four ICCM conferences (Cleveland, Boston, Geneva, Washington DC). They have been a great way to understand the organizations that comprise the humanitarian community, and more importantly, meet the individuals who power those organizations. It was exciting to present on our work at the HIU, and contribute back to the Crisis Mapping community.

All of the Ignite talk videos are available at the Crisis Mappers Website (lineup .pdf) and collectively they represent a solid cross-section of the field. At the macro-level, I believe the story continues to be about the integration of these new tools and methodologies into established humanitarian practices. The toolkits are stabilizing (crowdsourcing, structured data collection using SMS, volunteer networks, open geographic data and mapping, social media data mining) and are being adopted by the major humanitarian organizations. While I am partial towards crowdsource mapping, the Digital Humanitarian Network and the UN OCHA Humanitarian eXchange Language (HXL) are two other exciting projects.

Uganda mapping project

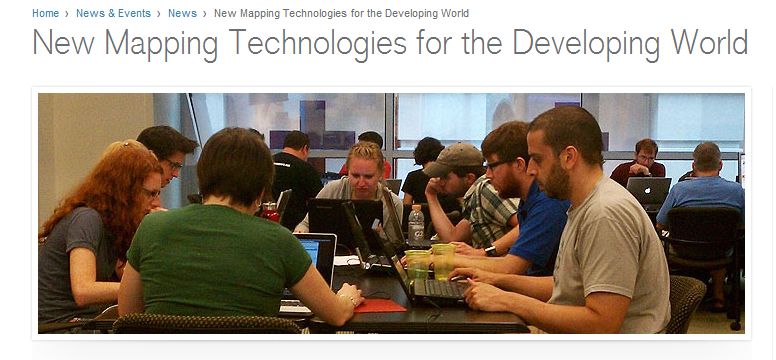
The Humanitarian Information Unit has for the second time worked with the Humanitarian OpenStreetMap Team to deliver high resolution commercial satellite imagery to the crowd. For this project we helped support the American Red Cross with a disaster risk reduction project focused on the citites of Gulu and Lira in northwest Uganda. Details of the project can be found on the Red Cross blog, “We Start With A Good Map” and the recent Red Cross news article “New Mapping Technologies for the Developing World.” One exciting element of this project is that ARC staff are working directly with locals in country on the project and helping to provide additional local knowledge to the map.

The HIU tasked, processed, and served the imagery using its CyberGIS computing infrastructure (more on this coming). The imagery services have been running for a couple weeks and the mapping results are quite stunning. The amount of detail in Gulu surprises me every time I look at it, especially the trees, huts, and buildings. The maps below are interactive and can be used to zoom and pan around the OpenStreetMap data. Details on how to help with the mapping task, or any other mapping task, can be found at the OSM Tasking Server.

Export as KML for Google Earth/Google MapsOpen standalone map in fullscreen modeExport as GeoJSONExport as GeoRSS
Gulu, Uganda

loading map - please wait...

Gulu, Uganda 2.773479, 32.304783 Imagery to the Crowd Project: Gulu, Uganda See the OSM Tasking Manager for details: http://tasks.hotosm.org/job/50 Uganda Mapping Project: DisruptiveGeo blog

Lira appears to be a smaller town, with less overall mapping, but the building mapping is equally detailed.

Export as KML for Google Earth/Google MapsOpen standalone map in fullscreen modeExport as GeoJSONExport as GeoRSS
Lira, Uganda

loading map - please wait...

Lira, Uganda 2.248187, 32.896156 Imagery to the Crowd Project: Lira, Uganda See the OSM Tasking Manager for more details: http://tasks.hotosm.org/job/51 Uganda Mapping Project: DisruptiveGeo blog

Imagery to the Crowd…early results

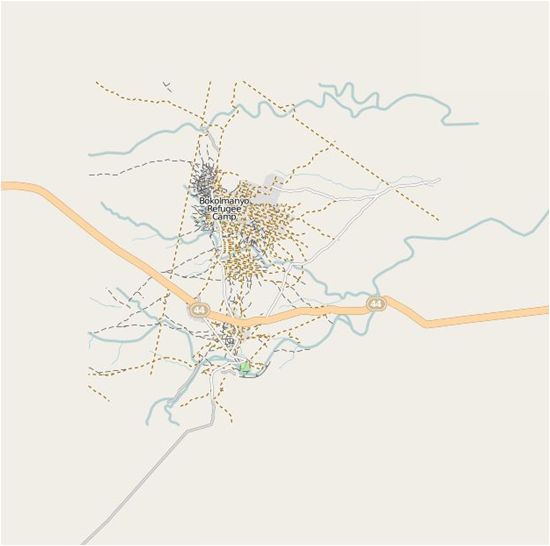
We have been busy reviewing the results of the Camp Roberts / Relief 12-3 mapping experiment for the Horn of Africa. In this phase of the project, the OpenStreetMap (OSM) community was provided short-term access to high resolution commercial satellite imagery over two large collections of refugee camps in Ethiopia (Dollo Ado) and Kenya (Dadaab).  The goal was to map the roads and footpaths in 10 refugee camps, that contain a population over 600,000 people, in 48 hours. A more detailed numerical analysis of the data will follow, but from a qualitative perspective the results are amazing. Below are examples taken from one specific camp, the Bokolmanyo camp in Ethiopia, and links to each of the 10 camps mapped in the experiment.

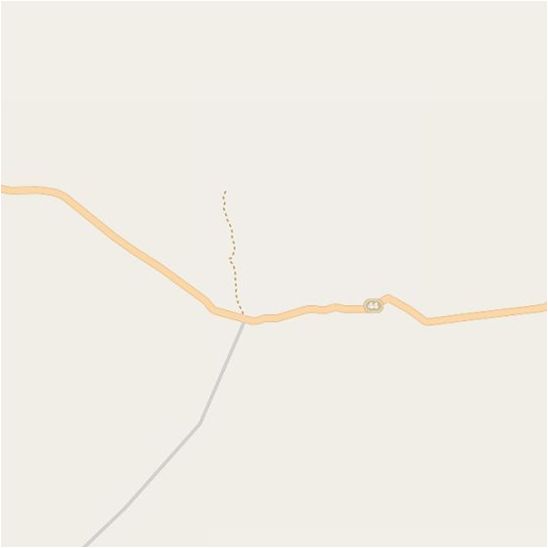
Bokolmanyo before the mapping experiment
Bokolmanyo refugee camp in the OSM database on 20 May 2012
Bokolmanyo after the mapping experiment
Bokolmanyo refugee camp in the OSM database on 28 May 2012

The ‘Dollo Ado’ refugee camp in Ethiopia is actually composed of 5 individual camps. These camps literally did not exist in OSM before the experiment began. The latest population estimates for the camps report that in total there are 151,972 individuals / 36,721 households living in the Dollo Ado camps (from the UNHCR data portal for the Horn of Africa, and specifically the 22 May 2012 Dollo Ado population statistical report).

Export as KML for Google Earth/Google MapsOpen standalone map in fullscreen modeExport as GeoJSONExport as GeoRSS
Dollo Ado Refugee Camps

loading map - please wait...

Bokolmanyo: 4.549560, 41.539478
Melkadida: 4.522779, 41.720324
Kobe: 4.481878, 41.742554
Helawein: 4.368492, 41.861429
Buramino: 4.303960, 41.915073


Similarly, the ‘Dadaab’ camp in Kenya is also composed 5 individual camps with a total of 465,334 individuals living there (UNHCR 20 May 2012 Dadaab population statistical report). These camps have been in operation longer than Dollo Ado, and contains 3 times more people. At the beginning of the experiment 3 of these camps had some map data in OSM, however the newer Ifo 2 and Kambioos camps were non-existent. All camps had significant improvements.

Export as KML for Google Earth/Google MapsOpen standalone map in fullscreen modeExport as GeoJSONExport as GeoRSS
Dadaab Refugee Camps

loading map - please wait...

Dagahaley: 0.193290, 40.286608
Ifo 2: 0.148573, 40.318623
Ifo: 0.119047, 40.315189
Hagadera: 0.009999, 40.370765
Kambioos: -0.043087, 40.370121


These impressive results are due to the hard work of a wide range of people, and I would like to thank several of them: first is the OSM volunteers who donated their time and energy to mapping these camps – you literally helped put 600,000 people on the map; the HIU technology team who went above and beyond in getting the tech stack running; the State Department, Office of the Geographer (Lee Schwartz and Benson Wilder) – USAID Office of Foreign Disaster Assistance (Chad Blevins) – USG partners (Katie Baucom and Nat Woolpert) who were key to keeping the process moving; John Crowley for providing constant energy and opening the Camp Roberts venue as a place to work; Kate Chapman and Schuyler Earl from the Humanitarian OpenStreetMap Team for advising on the process and making modifications to the tasking server to accommodate NextView; the UN’s Operational Satellite Applications Programme (UNOSAT) for its early help with image processing and serving.

Let’s hope this is just the beginning. I’ll be posting the results of the numerical analysis here, as well as details on the actual request workflow and technological implementation.

GIS 2.0 and Humanitarian Information Management Lecture

Today I gave a guest lecture to the Prof. Stephen Egbert and Prof. Shannon O’Lear ‘s ‘Geography and Genocide’ class (Geography 571) at the University of Kansas. Students in this class come from a range of backgrounds, so the content was designed as an introduction to GIScience and it’s potential applications. This included a brief review of GIS 2.0 concepts, and moved on to show how these tools are being utilized in humanitarian applications.

It is always interesting to introduce people to these technologies. The Open Street Map – Project Haiti video just blows people away. I like to show it first as an indication of what GIS 2.0 is all about — open source GIS software combined with inexpensive, powerful hardware is allowing people to interact, produce, and consume geographic data in amazing ways. Back this up with a review of Ushahidi-Haiti, the role of Twitter in Iran, and the utility of virtual globes loaded with high-resolution satellite imagery in Darfur, and you see the lights go on.

OpenStreetMap – Project Haiti from ItoWorld on Vimeo.

This lecture also gave me the opportunity to review some the KML datasets I have been working on for the Humanitarian Information Unit regarding Darfur and DRC. While there is nothing earth-shattering about mapping point data in KML, utilizing the time component and animation capability in Google Earth does begin to translate a dataset into a story (or geo-narrative as Madden and Ross call it). I’ll make these available as soon as possible.

The PowerPoint presentation can be downloaded here (23MB).