Geography jobs at the U.S. Department of State

Update: Both jobs have been filled (21 Sept 2013)

The Jobs

Available immediately, the U.S Department of State is looking to fill two positions related to geographic analysis and geographic programming. The Office of eDiplomacy, the State Department’s knowledge management gurus, want to build a first-rate geographic application development team. The two-person team will work with DoS bureaus to understand their workflows, leverage the geographic components of their data, and build custom geographic applications to help them. The team will be composed of one GIS applications developer, and one GIS analyst. Each position will require a substantial overlap in skills, meaning the developer must understand GIS analysis and the analyst will have to have some programming experience.

The Backstory

Over the past two years I have been working as the GIS Architect at the Humanitarian Information Unit, a division of the Office of the Geographer and Global Issues, Bureau of Intelligence and Research at the U.S. Department of State.

In that capacity, I started a project to build a completely open source geographic computing infrastructure focused on humanitarian applications. Called the CyberGIS, this project is built exclusively from open source geographic technology including, PostGIS/PostgreSQL, GeoServer, TileCache, OpenLayers, and TileMill, along with the standard Ubuntu, Apache, Tomcat, jQuery components, and we host our production environment in Amazon Web Services. Using the term CyberGIS was intentional and intended to place the project inline with on-going efforts in the academic community to unite the worlds of geographic information science and cyberinfrastructure.

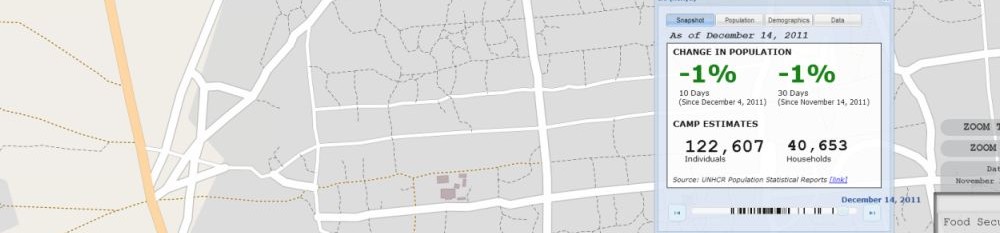
We have used this infrastructure to build several HIU geographic web applications, including the Imagery to the Crowd projects. These award winning projects are just the beginning for the CyberGIS at the HIU, we have several applications under development that we hope to unveil publicly in the coming months. The success of the HIU CyberGIS has raised the attention of geography in the Department, and the fact that eDiplomacy is building this development team is a huge step in expanding the power of Geography to the entire State Department. Two years ago I could not have expected that we could move this far this fast, and now we have an opportunity to fundamentally influence how the Department operates.

The Ask

If you have serious GIS analysis and open source geographic developer skills and want to be part of a geographic revolution, then I encourage you to apply. We need forward leaning, capable folks who fundamentally understand spatial analysis and geographic technololgy. You must be willing to work hard and be leaders in showing how geographic data and analysis can improve American diplomacy. This is a unique moment and we need the right team.

The main Careers page on the ActioNet website is here

The GIS Business Analyst position here

The GIS Developer position here

Export as KML for Google Earth/Google MapsOpen standalone map in fullscreen modeExport as GeoJSONExport as GeoRSS
U.S. Department of State

loading map - please wait...

U.S. Department of State 38.894607, -77.048439 Geography Jobs Here

.


Print Friendly, PDF & Email

Unifying Illustrator, TileMill / CartoCSS, and GeoServer

With the release of TileMill 0.10.0, there are a series of new compositing operations available within the CartoCSS language and rendering engine. A brief review of these features seems to open up a world of new potential.

However, I have a problem. I work in an organization where our primary product is a hard-copy map. As we evolve our product line, our challenge is to produce digital, interactive, web-enabled versions of our hard-copy map content and maintain a high-level of cartographic goodness. Our cartographic team works in Adobe Illustrator, and are quite proficient in it.

The problem we face is having to do cartographic work twice in order to switch between Illustrator and the Web. There has to be a better way. We are currently using TileMill for a significant amount of our web rendering, but also intend to transition to GeoServer. This means we have .AI, CartoCSS and .SLD in the mix.

We need to keep Illustrator as our foundation for creating content, so what is the best option to extend to the web? First is the problem of converting from .AI to CartoCSS, specifically the conversion of graphic styles for each Illustrator layer to its CartoCSS equivalent. I’ve never heard of a converter tool for this and am interested to know if anyone (@opengeo @ortelius @mapbox @ericg @tmcw @springmeyer @kelso @mattpriour…anyone at Adobe) has an idea if it is feasible or the amount of effort it would take.

Second is the problem of having to convert .AI to both CartoCSS for TileMill and SLD for GeoServer. The best option would be to have GeoServer consume CartoCSS natively, that way offline tiles and web services could maintain the same cartographic styling.

I posed similar questions on Twitter to @cageyjames and @spara, and @spara’s reply got me thinking whether I was looking at this question the wrong way. Is this too old school to be considering tools like this, so I wanted to know if anyone else had been thinking about it.

Thankfully @mattpriour replied that work was already being planned at OpenGeo to implement CartoCSS for GeoServer. And @godwinsgo also replied that GeoServer already has some form of CSS style rendering. So it looks like the CartoCSS in GeoServer has a chance of being completed, that just leaves the .AI to CartoCSS conversion.

Anyone have any thoughts?

Print Friendly, PDF & Email

OpenStreetMap Animations

The purpose of this post is to simply collect in one place some of the amazing animations ITO World has produced from the OpenStreetMap database. I am often searching around on Vimeo to find them, so I thought it might be useful to put them here, especially as several new ones have been recently released. These visualizations come across as very professional, they have a high production value and include a good soundtrack. I don’t personally know any of the folks at Ito World, but would love to know what software they use to produce the animations.

US edits to OpenStreetMap 2007-2012 from ItoWorld.

The new animations expand on the popular ‘Year of Edits’ series, this time for 2011 and 2010:

OSM 2011: A Year of Edits from ItoWorld.

OSM 2010: A Year of Edits from ItoWorld.

And a comparison of 4 years of edits:

OSM 4UP: Four Years of Edits 2008-2011 from ItoWorld.

The one I still find the most amazing is the animation depicting the Haiti Earthquake response. I often use this animation to help explain the value of OpenStreetMap and the volunteer mapping community in a disaster response situation. The ‘Imagery to the Crowd‘ concept is a direct result of the Haiti response.

OpenStreetMap – Project Haiti from ItoWorld.

Print Friendly, PDF & Email

Uganda mapping project

The Humanitarian Information Unit has for the second time worked with the Humanitarian OpenStreetMap Team to deliver high resolution commercial satellite imagery to the crowd. For this project we helped support the American Red Cross with a disaster risk reduction project focused on the citites of Gulu and Lira in northwest Uganda. Details of the project can be found on the Red Cross blog, “We Start With A Good Map” and the recent Red Cross news article “New Mapping Technologies for the Developing World.” One exciting element of this project is that ARC staff are working directly with locals in country on the project and helping to provide additional local knowledge to the map.

The HIU tasked, processed, and served the imagery using its CyberGIS computing infrastructure (more on this coming). The imagery services have been running for a couple weeks and the mapping results are quite stunning. The amount of detail in Gulu surprises me every time I look at it, especially the trees, huts, and buildings. The maps below are interactive and can be used to zoom and pan around the OpenStreetMap data. Details on how to help with the mapping task, or any other mapping task, can be found at the OSM Tasking Server.

Export as KML for Google Earth/Google MapsOpen standalone map in fullscreen modeExport as GeoJSONExport as GeoRSS
Gulu, Uganda

loading map - please wait...

Gulu, Uganda 2.773479, 32.304783 Imagery to the Crowd Project: Gulu, Uganda See the OSM Tasking Manager for details: http://tasks.hotosm.org/job/50 Uganda Mapping Project: DisruptiveGeo blog

Lira appears to be a smaller town, with less overall mapping, but the building mapping is equally detailed.

Export as KML for Google Earth/Google MapsOpen standalone map in fullscreen modeExport as GeoJSONExport as GeoRSS
Lira, Uganda

loading map - please wait...

Lira, Uganda 2.248187, 32.896156 Imagery to the Crowd Project: Lira, Uganda See the OSM Tasking Manager for more details: http://tasks.hotosm.org/job/51 Uganda Mapping Project: DisruptiveGeo blog

Print Friendly, PDF & Email

Imagery to the Crowd…early results

We have been busy reviewing the results of the Camp Roberts / Relief 12-3 mapping experiment for the Horn of Africa. In this phase of the project, the OpenStreetMap (OSM) community was provided short-term access to high resolution commercial satellite imagery over two large collections of refugee camps in Ethiopia (Dollo Ado) and Kenya (Dadaab).  The goal was to map the roads and footpaths in 10 refugee camps, that contain a population over 600,000 people, in 48 hours. A more detailed numerical analysis of the data will follow, but from a qualitative perspective the results are amazing. Below are examples taken from one specific camp, the Bokolmanyo camp in Ethiopia, and links to each of the 10 camps mapped in the experiment.

Bokolmanyo before the mapping experiment
Bokolmanyo refugee camp in the OSM database on 20 May 2012
Bokolmanyo after the mapping experiment
Bokolmanyo refugee camp in the OSM database on 28 May 2012

The ‘Dollo Ado’ refugee camp in Ethiopia is actually composed of 5 individual camps. These camps literally did not exist in OSM before the experiment began. The latest population estimates for the camps report that in total there are 151,972 individuals / 36,721 households living in the Dollo Ado camps (from the UNHCR data portal for the Horn of Africa, and specifically the 22 May 2012 Dollo Ado population statistical report).

Export as KML for Google Earth/Google MapsOpen standalone map in fullscreen modeExport as GeoJSONExport as GeoRSS
Dollo Ado Refugee Camps

loading map - please wait...

Bokolmanyo: 4.549560, 41.539478
Melkadida: 4.522779, 41.720324
Kobe: 4.481878, 41.742554
Helawein: 4.368492, 41.861429
Buramino: 4.303960, 41.915073


Similarly, the ‘Dadaab’ camp in Kenya is also composed 5 individual camps with a total of 465,334 individuals living there (UNHCR 20 May 2012 Dadaab population statistical report). These camps have been in operation longer than Dollo Ado, and contains 3 times more people. At the beginning of the experiment 3 of these camps had some map data in OSM, however the newer Ifo 2 and Kambioos camps were non-existent. All camps had significant improvements.

Export as KML for Google Earth/Google MapsOpen standalone map in fullscreen modeExport as GeoJSONExport as GeoRSS
Dadaab Refugee Camps

loading map - please wait...

Dagahaley: 0.193290, 40.286608
Ifo 2: 0.148573, 40.318623
Ifo: 0.119047, 40.315189
Hagadera: 0.009999, 40.370765
Kambioos: -0.043087, 40.370121


These impressive results are due to the hard work of a wide range of people, and I would like to thank several of them: first is the OSM volunteers who donated their time and energy to mapping these camps – you literally helped put 600,000 people on the map; the HIU technology team who went above and beyond in getting the tech stack running; the State Department, Office of the Geographer (Lee Schwartz and Benson Wilder) – USAID Office of Foreign Disaster Assistance (Chad Blevins) – USG partners (Katie Baucom and Nat Woolpert) who were key to keeping the process moving; John Crowley for providing constant energy and opening the Camp Roberts venue as a place to work; Kate Chapman and Schuyler Earl from the Humanitarian OpenStreetMap Team for advising on the process and making modifications to the tasking server to accommodate NextView; the UN’s Operational Satellite Applications Programme (UNOSAT) for its early help with image processing and serving.

Let’s hope this is just the beginning. I’ll be posting the results of the numerical analysis here, as well as details on the actual request workflow and technological implementation.

Print Friendly, PDF & Email

Imagery to the crowd…phase 1

Over the past year, the Humanitarian Information Unit (HIU) at the U.S. State Department has been working with the Humanitarian OpenStreetMap Team (HOT) to publish current high-resolution commercial satellite imagery during humanitarian emergencies. The imagery is used to map the affected areas, and provide a common framework for governments and aid agencies to work from. All of the map data is stored in the OpenStreetMap database (http://osm.org ), under a license that ensures the data is freely available and open for a range of uses.

This work began as part of the RELIEF Exercises 11-4 at Camp Roberts in August 2011, and focused primarily on the legal and policy issues associated with sharing imagery. Now with RELIEF Exercise 12-3 happening in DC this week, the project is moving into its first technical implementation. As a proof of concept, the HIU is publishing imagery for the refugee camps in the Horn of Africa, and making the imagery available to the volunteer mapping community. The goal is to produce detailed vector data for the refugee camps, including roads and footpaths in and around the camps. There are tens of thousands of refugees living in these camps who are victims of famine and conflict, and these data can be used to improve planning for humanitarian assistance.

How to help: We are going to open access to the imagery on Monday 21 May 2012. We would like to spend two 24-hour periods tracing the areas of interest, which will include 11 refugee sites. All work will be done through the HOT Tasking Manager (http://tasks.hotosm.org), a microtasking platform that will split up the image tracing into ‘tiles’ that will require approximately 30-45 minutes to map.

Accomplishing this task will require that volunteers become familiar with OpenStreetMap and the basic concepts of mapping. But, don’t worry, there are plenty of resources out there to help. For more information on the OpenStreetMap (OSM) process, see the “Beginning OpenStreetMap Tutorial” available from the LearnOSM website (http://learnOSM.org), specifically Chapters 1,2,3,6. For more information on HOT’s work in Somalia see the HOT Somalia project page, and other HOT related materials on the HOT wiki.

Print Friendly, PDF & Email

Installing Quantum GIS and GRASS GIS on Ubuntu 10.04 (Lucid Lynx)

While most advanced linux users will find this post elementary, as a ‘know enough to be dangerous’ linux user I often struggle with the simple tasks. With that in mind, this is a brief summary of the steps required to install QGIS and GRASS on Ubuntu 10.04.

The instructions provided by both the QGIS and GRASS websites are actually quite good, but there are a couple steps that intro users might miss. In terms of the workflow, the process is as such:

1. Add a new software repository
2. Reload the repository (note: this is what they don’t tell you)
3. Install software

Step 1: Add a new software repository
It appears there are a couple ways to do this: GUI, modify the /etc/apt/sources.list file, and through terminal. Since the directions on the QGIS and GRASS websites use the terminal approach, I did as well and then checked the results through the GUI.

The QGIS site posts the following:

sudo apt-get install add-apt-repository 
sudo add-apt-repository ppa:ubuntugis/ubuntugis-unstable
sudo apt-get install qgis

In my case, running these commands in sequence resulted in a error: “Package qgis is not available…” So to check what is happening I looked at the Software Sources (System–>Administration–>Software Sources) and specifically the second tab “Other Software”. If the second line of the code above executed, you will have a reference to “http://ppa.launchpad.net/ubuntugis/ubuntugis-unstable/ubuntu”. This is the correct URL that Ubuntu should look at to find the required binaries, but something is off.

The problem is that Ubuntu does not automatically check the repository for the software contained within it. To force an update, you have two choices. First is to use the GUI: Select the ppa.launchpad.net reference, then select ‘Edit’, don’t change anything, then select ‘Close’. The GUI will prompt that it needs to refresh, select yes. The second option would be to run: sudo apt-get update (I think). Either way, once the update completes, you can run the ‘sudo apt-get install qgis’ and it will install correctly. To install GRASS, run the command ‘sudo apt-get install grass’

I am working on the final stages of the long-delayed ‘Flat Map’ and needed to get the latest versions of the open-source GIS stack up and running. Processing for the continental U.S. is complete, the remaining steps include the creation of the index and the zonal statistics by state. Hope to have it completed by the end of October.

Print Friendly, PDF & Email

Modifying the KARS GeoNetwork metadata catalog

We recently had an inquiry at the Kansas Applied Remote Sensing Program (KARS) about modifications we made to our GeoNetwork instance. Specifically, the question was about setting the Intermap window to open in the large format on load, and setting the map extent.

We run the Windows version of GeoNetwork and have used these modifications for Versions 2.2, 2.4.2, and 2.4.3.

First, to call the Intermap function we modified the following files:
\geonetwork\web\geonetwork\xsl\main.xsl
\geonetwork\web\geonetwork\xsl\main-page.xsl
\geonetwork\web\geonetwork\geonetwork.css

1) main.xsl – @ line 18 added ‘openIntermap’ function call to the onLoad event


<body onload="init(), openIntermap()">

2) main-page.xsl – @ line 281, “fillMeWithIntermap”, add ‘width: 700px;’

<tr id="intermaprow"  width="100%" height="0">
  <xsl:comment>COLLAPSABLE MAP</xsl:comment>
    <td>
      <strong><div id="fillMeWithIntermap" style="display: none; width: 700px;"></strong>
      <!--  This DIV will be filled dynamically with intermap contents -->
      </div>
    </td>
</tr>

Note that this modification did require some additional CSS modifications, specifically the Z-Index of the map elements had to be re-ordered so they would be drawn last.

Second, modifying the properties that Intermap used at load were modified in the file:
\geonetwork\web\intermap\scripts\im_bigmap.js

3) In row 19 and 20, change the initial width and height of window from w=368 h=276 to w=450 h=300.

 // these are the values of initial width and height. 
var im_bm_wsize0 = 450;
var im_bm_hsize0 = 300;

4) Inserted a line (line 19) to define the map extent (zoom) of the Intermap big map window to North America.

 Line 19: im_bm.setBBox(51.56155, -66.07543, 21.629387, -125.93976)
Line 20 for comments: // view of the United States (minx="-125.93976" miny="21.629387" maxx="-66.07543" maxy="51.56155") 

5) Modified the default scale zoom parameters for the intermap window on load to include 1:24,000.
File: \geonetwork\web\intermap\xsl\index-embedded.xsl

At line 141, an option for the value “24000” was added


<select name="im_setscale" id="im_setscale" onchange="javascript:im_bm_setScale();">
<option id="im_currentscale" value=""><xsl:value-of select="/root/gui/strings/setScale</option>                    
    <option value="50000000">1:50.000.000</option>
    <option value="10000000">1:10.000.000</option>
    <option value="5000000">1:5.000.000</option>
    <option value="1000000">1:1.000.000</option>
    <option value="500000">1:500.000</option>
    <option value="100000">1:100.000</option>
    <option value="50000">1:50.000</option>
    <option value="24000">1:24.000</option>
    <option value="10000">1:10.000</option>
    <option value="5000">1:5.000</option>
    <option value="1000">1:1.000</option>                    
</select>

Additional modifications can be found in the following document KBS_GeoNetwork_Modifications. Any comments or additional suggestions for modifications are welcome.

Print Friendly, PDF & Email

GIS 2.0 and Humanitarian Information Management Lecture

Today I gave a guest lecture to the Prof. Stephen Egbert and Prof. Shannon O’Lear ‘s ‘Geography and Genocide’ class (Geography 571) at the University of Kansas. Students in this class come from a range of backgrounds, so the content was designed as an introduction to GIScience and it’s potential applications. This included a brief review of GIS 2.0 concepts, and moved on to show how these tools are being utilized in humanitarian applications.

It is always interesting to introduce people to these technologies. The Open Street Map – Project Haiti video just blows people away. I like to show it first as an indication of what GIS 2.0 is all about — open source GIS software combined with inexpensive, powerful hardware is allowing people to interact, produce, and consume geographic data in amazing ways. Back this up with a review of Ushahidi-Haiti, the role of Twitter in Iran, and the utility of virtual globes loaded with high-resolution satellite imagery in Darfur, and you see the lights go on.

OpenStreetMap – Project Haiti from ItoWorld on Vimeo.

This lecture also gave me the opportunity to review some the KML datasets I have been working on for the Humanitarian Information Unit regarding Darfur and DRC. While there is nothing earth-shattering about mapping point data in KML, utilizing the time component and animation capability in Google Earth does begin to translate a dataset into a story (or geo-narrative as Madden and Ross call it). I’ll make these available as soon as possible.

The PowerPoint presentation can be downloaded here (23MB).

Print Friendly, PDF & Email

GIS 2.0 lecture at the University of Kansas

On Tuesday (23 Feb 2010) I presented a lecture to Prof. Terry Slocum’s Geography seminar on Neogeography. The class is a good group and have plans for an interactive web map of the KU campus.

Beyond the lecture summary, a Google LatLong blog post describes a new method for using Google Fusion tables for storing geographic data and creating custom maps. I believe this may be a real benefit for this group, and take some of the programming difficulty out of creating this application.

Link to blog post: http://google-latlong.blogspot.com/2010/02/mapping-your-data-with-google-fusion.html

Lecture Presentation:

Neogeography Lecture for KU Geography 911 (JSC)

Print Friendly, PDF & Email